Time and Expense Reports
The report and dashboard capabilities of LogSpace℠ allows you to view graphs and inspect your team information using search filters and custom columns. Once you have the report configured just right, you can export time logs and expenses for your team.
Dashboard Visualization

Look at a graphical representation of your time logs and expenses.
Check out what your team is doing at a glance. Or compare your time and expenses with historical data. A picture is worth a thousand words.
View Your Team's Time Logs and Expenses

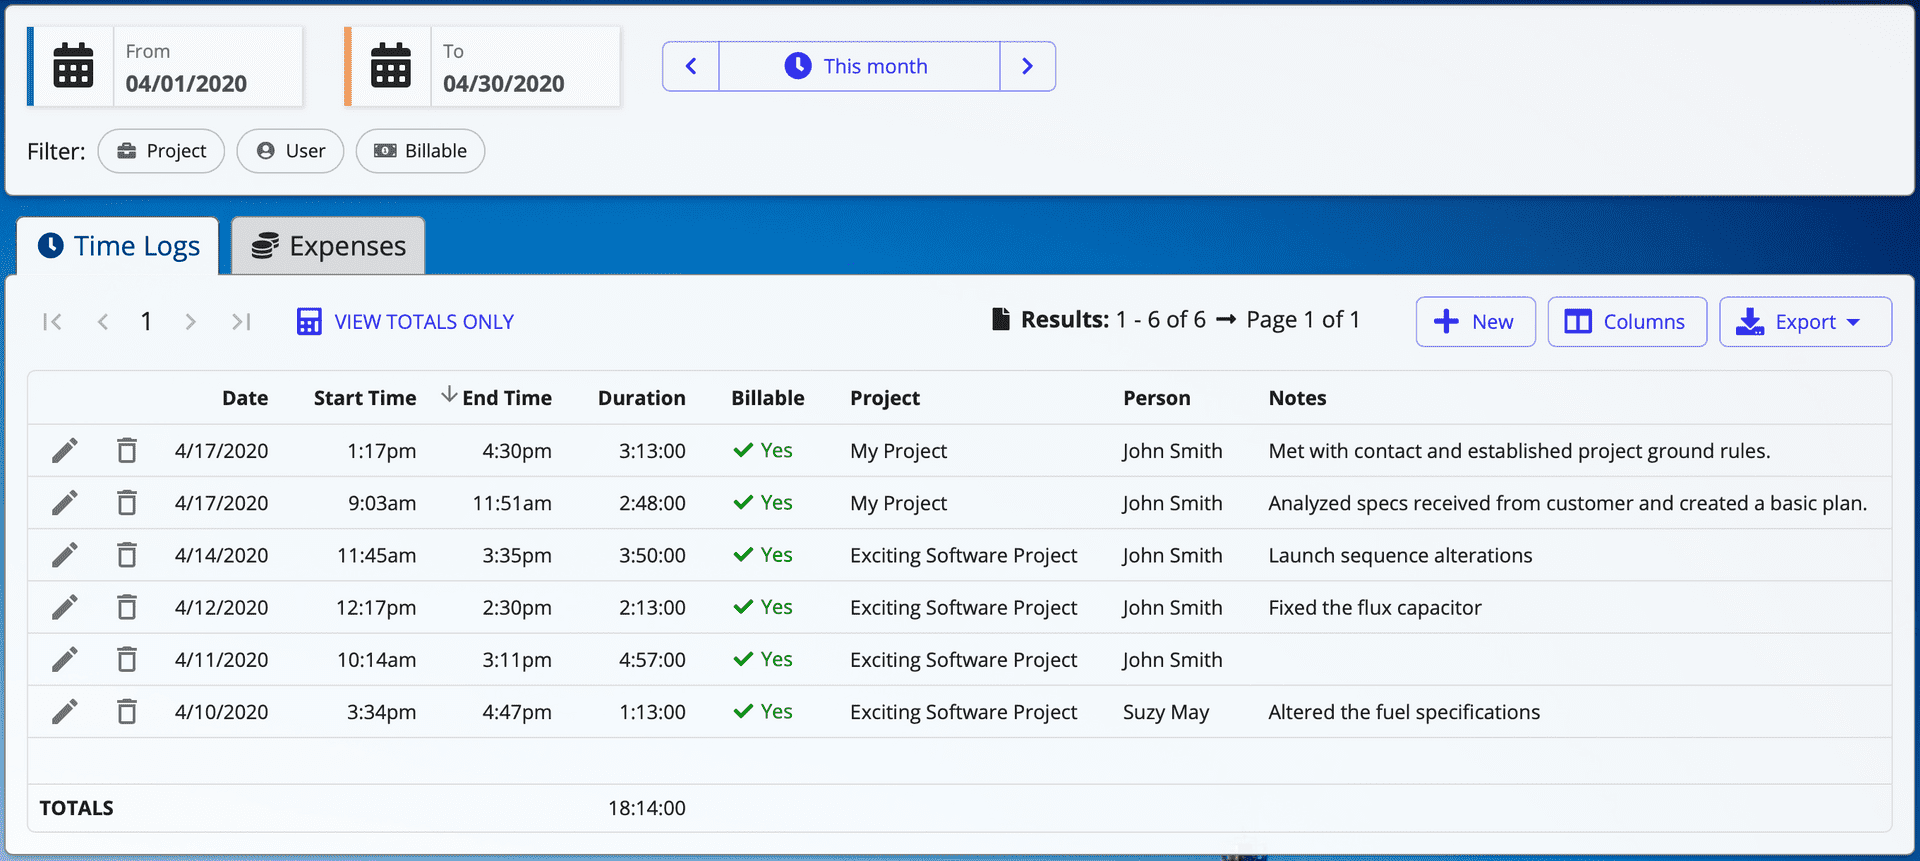
Get a listing of your team's expenses as well as time logs and the number of hours worked.
Tap the column headers to sort the results.
If you only care about the totals, use the handy "View Totals Only" button.
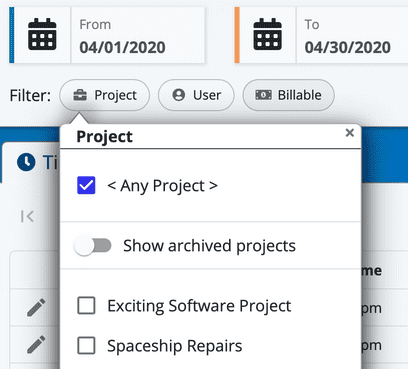
Filter by Date, Project, User, or Billable Status

Use the date filter to pick from a calendar, or type in a date just like when you edit time logs or expenses.
Also filter by projects, users, and/or billable status.
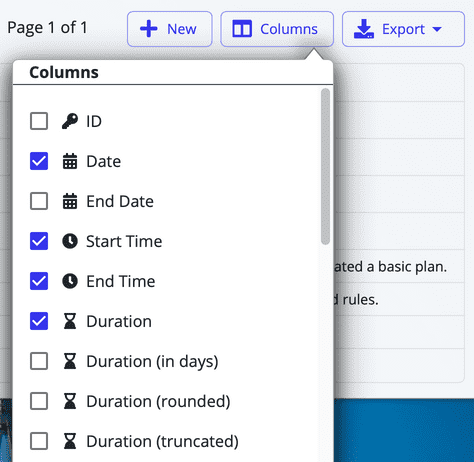
Choose Columns and Export Results

Customize the columns in your report. Optionally include hours rounded in 6 or 15 minute increments.
Export to Excel or CSV using the filter and column selections you've made.
All of these columns are also available when you want to customize spreadsheet attachments for invoice emails that you send your clients.